Datanami
 EnterpriseAI
 HPCwire Japan
 QCwire
 HPC & AI Wall Street
Energy efficiency is rapidly becoming a key factor for many modern high-performance computing (HPC) datacenters. It poses various challenges, which need to be addressed holistically and in an integrated manner, covering the HPC system environment (system hardware and system software), the hosting facility and infrastructure (cooling technologies, energy re-use, power supply chain, etc.), and applications (algorithms, performance metrics, etc.).
Most of the management schemes present in current HPC datacenters do not allow data to be shared between the HPC system environment, hosting facility, and infrastructure. But, it is important to collect and correlate data from all aspects of the datacenter in order to: better understand the interactions between different components of the datacenter; spot the improvement possibilities; and assess any introduced improvements. There are currently no tools that support a complete collection and correlation of energy efficiency relevant data, allowing for a unified view of energy consumption present in the datacenter.
That’s why a new energy measuring and evaluation toolset is being developed at the Leibniz Supercomputing Centre of the Bavarian Academy of Sciences (BAdW-LRZ) which is capable of monitoring and analysing the energy consumption of a supercomputing site in a holistic way, combining the HPC systems with data from the cooling and building infrastructure. The tool, named Power Data Aggregation Monitor (PowerDAM), allows the collection and evaluation of sensor data independently from the source systems and is capable of monitoring not only HPC systems but any other infrastructure that can be represented as a hierarchical tree. It monitors physical sensors as well as virtual sensors which can represent different functional compositions of several physical sensors.
PowerDAM provides a plug-in framework for defining the desired monitored entities such as IT systems, building infrastructure, etc. Two plug-in interfaces for each monitored entity are provided: one for sensor data collection and one for collecting application relevant data (e.g., utilized compute nodes, starting and ending timestamps of application, etc.) from system resource management tools.
PowerDAM is an underlying framework for energy efficiency related research at BAdW-LRZ.
Evaluating and Reporting
Energy-to-Solution (EtS) is an important metric for PowerDAM which denotes the aggregated energy consumption of an application consisting of the energy consumption of utilized compute nodes and partial sub-system components (e.g., system networking and system cooling).
Figure 1 presents the EtS report for an application executed on CoolMUC MPP Linux cluster. The first part of the report (part I) shows the sensor measurements for all utilized components in the order of timestamp, sensor name, value and unit.

Figure 1: EtS Report for an application executed on CoolMUC MPP Linux Cluster
Part II shows all approximations of source measurement data which were considered to be invalid (missing measurements, out of bounds data, etc.). Part III shows the aggregated energy consumption (EtS) of the executed application and provides information on the consumption percentages of computation, networking, and cooling.
The ability to calculate the EtS of an application allows for the further understanding and tuning of the application internally (via change of algorithms, memory access patterns, etc.) as well as externally through hardware adaptation (e.g., static/dynamic voltage frequency scaling).
PowerDAM provides various visualization options such as: the power draw, utilization rate, and averaged CPU temperatures of utilized compute nodes; correlation between power and load for these nodes; different EtS reports; and system power consumption for a given time frame (e.g. day, month, and year). Figure 2 illustrates one of these options – the EtS report (encompassing in parallel to the EtS, the percentages for computation, infrastructure, cooling, and networking) for all executed applications by a given user.

Figure 2: EtS Report for All Jobs Submitted by Given User
PowerDAM “node-map” view displays the dynamic behavior of compute nodes for a given sensor type. This view updates automatically after a customized amount of time and uses a color mapping to classify the behavior of the compute nodes (Figure 3).

Figure 3: Utilization Map of Compute Nodes for CoolMUC Linux Cluster. The color green illustrates the 96% to 100% utilization range. The color white illustrates the 0% and 90% to 95% utilization range. The color red illustrates the 1% to 89% utilization range. (not all compute nodes of the cluster are depicted)
The “node-map” view can be essential for understanding the interconnection between different sensor types. For example, correlating utilization rate (Figure 3) with CPU temperature (Figure 4) allows the investigation of the interdependency between utilization rates and CPU temperatures of defined compute nodes (nodes lxa130 and lxa17).
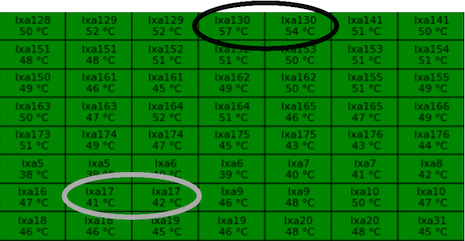
Figure 4: Temperature Map of Compute Nodes for CoolMUC Linux Cluster (2×8-core AMD CPUs per compute node)
(not all compute nodes of the cluster are depicted)
Further development will allow PowerDAM to: classify applications according to power draw, runtime, performance, and energy consumption; provide data necessary for the enhancement of the resource management systems; and report on datacenter key performance indicators (KPIs) such as PUE, ERE, DCiE, WUE, etc.
More detailed information on PowerDAM is available in the Proceedings of the First International Conference on Information and Communication Technologies for Sustainability under “Towards a Unified Energy Efficiency Evaluation Toolset: An Approach and Its Implementation at Leibniz Supercomputing Centre (LRZ)” and is indexed under DOI 10.3929/ethz-a-007337628.
The development of PowerDAM was made possible by the PRACE Second Implementation Phase project PRACE- 2IP in the Work Package “Prototyping” which has received funding from the European Community’s Seventh Framework Program (FP7/2007-2013) under grant agreement no. RI-283493 and within the SIMOPEK project which has received funding from the German Federal Ministry of Education and Research (BMBF) under grand agreement no. 01IH13007A. The work was achieved using the PRACE Research Infrastructure resources at BAdW-LRZ with support of the State of Bavaria, Germany.
The authors would like to thank Jeanette Wilde for her valuable comments and support.
Author Affiliations
Hayk Shoukourian(1,2); Torsten Wilde(1); Axel Auweter(1); Arndt Bode(1,2)
1Leibniz Supercomputing Centre of the Bavarian Academy of Sciences and Humanities (BAdW-LRZ)
2Technische Universität München (TUM), Fakultät für Informatik