Datanami
 EnterpriseAI
 HPCwire Japan
 QCwire
 HPC & AI Wall Street
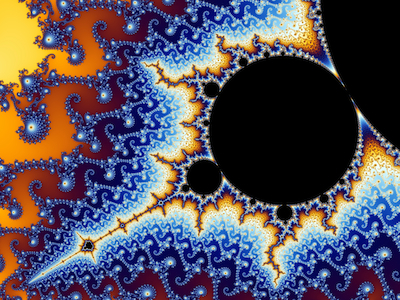
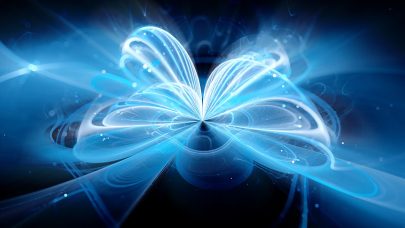
You don’t need to be a mathematician to appreciate the beauty and elegance of fractal geometries, those infinitely complex patterns that are self-similar across different scales. Recently, a group of computing and software students from McMaster University in Ontario, Canada, created stunning fractal geometries using the University of Toronto’s powerful IBM Blue Gene/Q supercomputer.
Despite being generated by a simple mathematical formula, the resulting images appear in infinite variations. The word “fractal,” Latin for broken or fractured, was coined by mathematician Benoit Mandelbrot in 1975. Initially applied to theoretical fractional dimensions, the term was extended to include geometric patterns in nature.
“Each pixel in an image is assigned coordinates,” explains Ned Nedialkov, associate professor in computing and software. “These starting coordinates are then fed into a formula, resulting in new coordinates, which are plugged into the same formula for the next iteration, and so on.”
Exploring a fractal can be compared to zooming in and out on a digital map.
“Imagine the whole eastern coast of Canada laid out on a map,” Nedialkov adds. “Then, as you zoom in and get closer, you can see the actually coast line, then the details of the beach, individual stones, pieces of sand, and then every molecule that makes up the sand.”
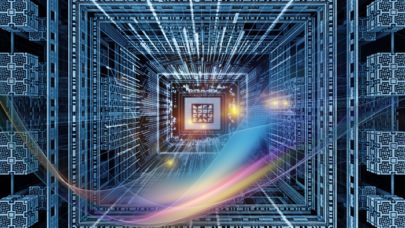
The shapes that unfold at each magnification level are based on computations that would take months to complete on a standard desktop computer. With supercomputers like the Blue Gene, that time is condensed to a matter of hours.
The Mandelbrot set fractal, brought to life in the video below, used 1,024 Blue Gene cores and took about nine and a half hours to execute. Named in honor of the famed mathematician, the set illustrates self-similarity – meaning as the image is enlarged, the same general pattern re-appears. This is in contrast to another type of fractal, which has shapes that are exactly the same at every scale.