Datanami
 EnterpriseAI
 HPCwire Japan
 QCwire
 HPC & AI Wall Street
A year later, the HPC-AI Advisory Council’s annual Stanford Conference is – once again – virtual due to the ongoing (if waning) COVID-19 pandemic. In contrast to the 2020 conference (which soldiered on through the earliest lockdowns with a schedule highlighting robotic jellyfish and weather forecasting), the 2021 conference emerged with the benefit of a full year of hindsight on the pandemic, standing as one of the first HPC conferences suited to answer the question: how, in retrospect, did COVID change our world?
Answering that question – at least, in part – was Andrew Gettelman, a senior scientist in the climate and global dynamics division of the National Center for Atmospheric Research (NCAR). Over the course of the past year, Gettelman and his colleagues (hailing from NCAR, Imperial College London, the University of Leeds and Oxford University) zeroed in on one particular question: with seismic shifts in human behavior across the world, how did COVID-19 affect the climate?
Untangling the variables of the pandemic

“Most of us have experienced changes to our mobility in the last year or so,” understated Gettelman, introducing a chart showing how mobility trends roller-coastered throughout the pandemic, leading – in many cases – to double-digit percentage drops in overall mobility (as tracked by mobile devices).”It’s been dramatic moves by as much as 60 percent in how people’s actions have changed and how our mobility has moved around – and that leads to changes in emissions and changes to the environment.”
“Many of you have seen anecdotal pictures like [these],” he continued, indicating a comparison of a smoggy Delhi afternoon in October 2019 and clear blue skies in the same spot in April 2020. Beyond the anecdotal, Gettelman highlighted measurable changes in nitrogen dioxide (a potent greenhouse gas) over Wuhan and, of course, massive (~75%) drops in air traffic (“There was probably no other sector quite as much affected as aviation,” he said).
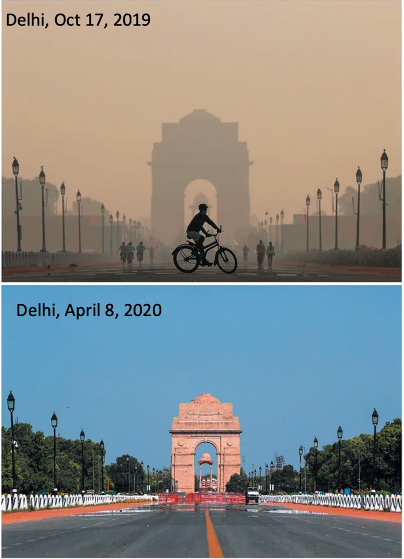 “Pollution is associated with transport and industry,” he explained, “and there were lots of changes to – initially – industry, and then continued changes to transport.”
But not all of the changes were in the directions one might expect. In India, for instance, there were massive decreases in emissions in many areas – but, due to weather, increases in emissions in others. The researchers worked to filter out these weather-related effects, finding, by and large, robust decreases in emissions across the studied areas (spanning the U.S., Europe, China, India, Chile and Australia) with a handful of exceptions (the eastern United States remained relatively static).
However, these effects were not universal across all emissions.
“Ozone … actually increased a little bit,” Gettelman said. “That’s due to complex air pollution chemistry, where if you reduce some of the sources of pollution like nitrogen … you can actually cause increases in ground-level ozone.”
Gettelman introduced a globe visualization of lockdowns as they oscillated across the world, popping in and out as the pandemic waxed and waned over the last year. “There’s lots of variability in this and trying to pull out the signal,” he said.
Overall, 2020 showed about a nine percent drop in oil use due to transport changes. “What’s interesting is there was also a drop in energy use in general in the coal, gas and nuclear sectors,” Gettelman said. “And that’s somewhat due to changes in energy demand for people moving around less, not needing to heat office buildings, not needing to use electricity in a lot of those areas.
Renewable energy use, on the other hand, increased. On the net: a 7 percent decrease in total carbon dioxide emissions (“Which is something like going back maybe five or ten years in our total emissions,” Gettelman said).
“Okay,” Gettelman said. “So: how do we model all this?”
The HPC of it all
On a basic level, he said, “it’s essentially just an accounting exercise constrained by physical law. … Think of a giant spreadsheet with entries for water, heat, wind, salt, carbon, pollution – all these different physical processes and physical states. … You can balance all these spreadsheets for the motion of things and how they interact in time and you can advance this in time and you just repeat.”
Of course, with that many variables repeating across grids that stretch across the entire world, the uncertainty quickly compounds.
“So how do we find small signals?” he continued. “We talk about a five or ten percent reduction in something – with all this weather noise, it gets very difficult to sort out.” The solution, he explained, was to fix the weather and then run different model scenarios with different sets of emissions. “We can do it for the COVID emissions we think actually happened, and we can do it for normal estimates of what a normal year would look like.”
“Obviously, we’re using some supercomputing to do this,” he said. “We’re using two earth system models: one was run at NCAR, on our Cheyenne computer in Wyoming; the other was run at [EC-Hamburg] – that was actually run on some UK systems. It’s an interactive atmosphere and land model, we fixed the ocean temperatures, the sea surface temperatures, and as I said, we nudge the meteorology … We do this at about a hundred-kilometer horizontal resolution with complex clouds and aerosols to get all these chemical interactions[.]”
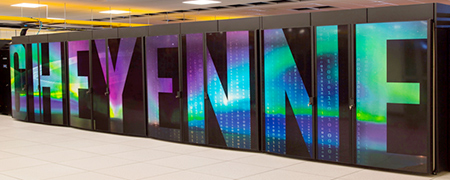
The team ran 20 simulations each of both the COVID and non-COVID scenarios, allowing them to create a robust ensemble study. Cheyenne, which is equipped with 4,032 Intel Xeon Broadwell-based nodes and 313 TB of memory, made short work of these simulations with its 4.8 Linpack petaflops. (Cheyenne ranked 60th on the most recent Top500 list.)
“These are actually fairly straightforward simulations that are made possible by the tremendous capacity of HPC,” Gettelman said. “Each of these simulations is using about 800 cores: for 20 of those, blowing them through at the same time, we’re only using about 15 percent of [Cheyenne] at its peak for something like two to three hours[.]”
The team got about four terabytes of data from the simulations, which they pared down to around 40 GB of data for analysis.
The results were surprising.
The takeaways

“We see reduction in aerosols [pollution] is actually associated with an increase in net energy,” Gettelman explained, “and that is about ten percent of the total effect, which more than offsets … any decrease due to CO2 reductions. So cleaner skies may have actually warmed the planet.”
“The global average effect is actually very, very small,” he hedged. “The global climate effect was … about three hundredths of a degree.”
Even with such a tiny effect, however, that little nudge may have made a big difference in the record books.
“Interestingly enough, 2020 was tied for the warmest year ever, and we wouldn’t expect it to be the warmest year ever based on the state of things – like the ocean and El Nino. But this small climate effect may have pushed it over the edge.”
To view the session from the Stanford Conference, click here.