Datanami
 EnterpriseAI
 HPCwire Japan
 QCwire
 HPC & AI Wall Street
For now, the U.S. still enjoys a leadership position in science and engineering worldwide according to the Science and Engineering Indicators 2018 report issued this month by the National Science Board, the governing body for the National Science Foundation.
 The U.S. invests the most in research and development (R&D), attracts the most venture capital, awards the most advanced degrees, provides the most business, financial, and information services, and is the largest producer in high-technology manufacturing sectors, according to the report. On the downside, China’s dramatic rise as a force in science continues to challenge U.S. preeminence. There’s also been a recent drop in the number of international students seeking graduate degrees in the U.S. “These students are a critical component of the U.S. workforce in these high demand fields,” says the report.
Issued every two years, the S&E Indicators report is painted with a broad brush that catches major trends but is slim on details for individual industries and science domains. Broadly, it’s a “scorecard” of U.S. S&E activities compared with the global community. The 2018 report again shows the U.S. leading in most categories, but NSB Chair Maria Zuber, struck a cautionary note on the results.
“This year’s report shows a trend that the U.S. still leads by many S&T measures, but that our lead is decreasing in certain areas that are important to our country. That trend raises concerns about impacts on our economy and workforce, and has implications for our national security. From gene editing to artificial intelligence, scientific advancements come with inherent risks. And it’s critical that we stay at the forefront of science to mitigate those risks,” said Zuber, who is also VP for Research at Massachusetts Institute of Technology.
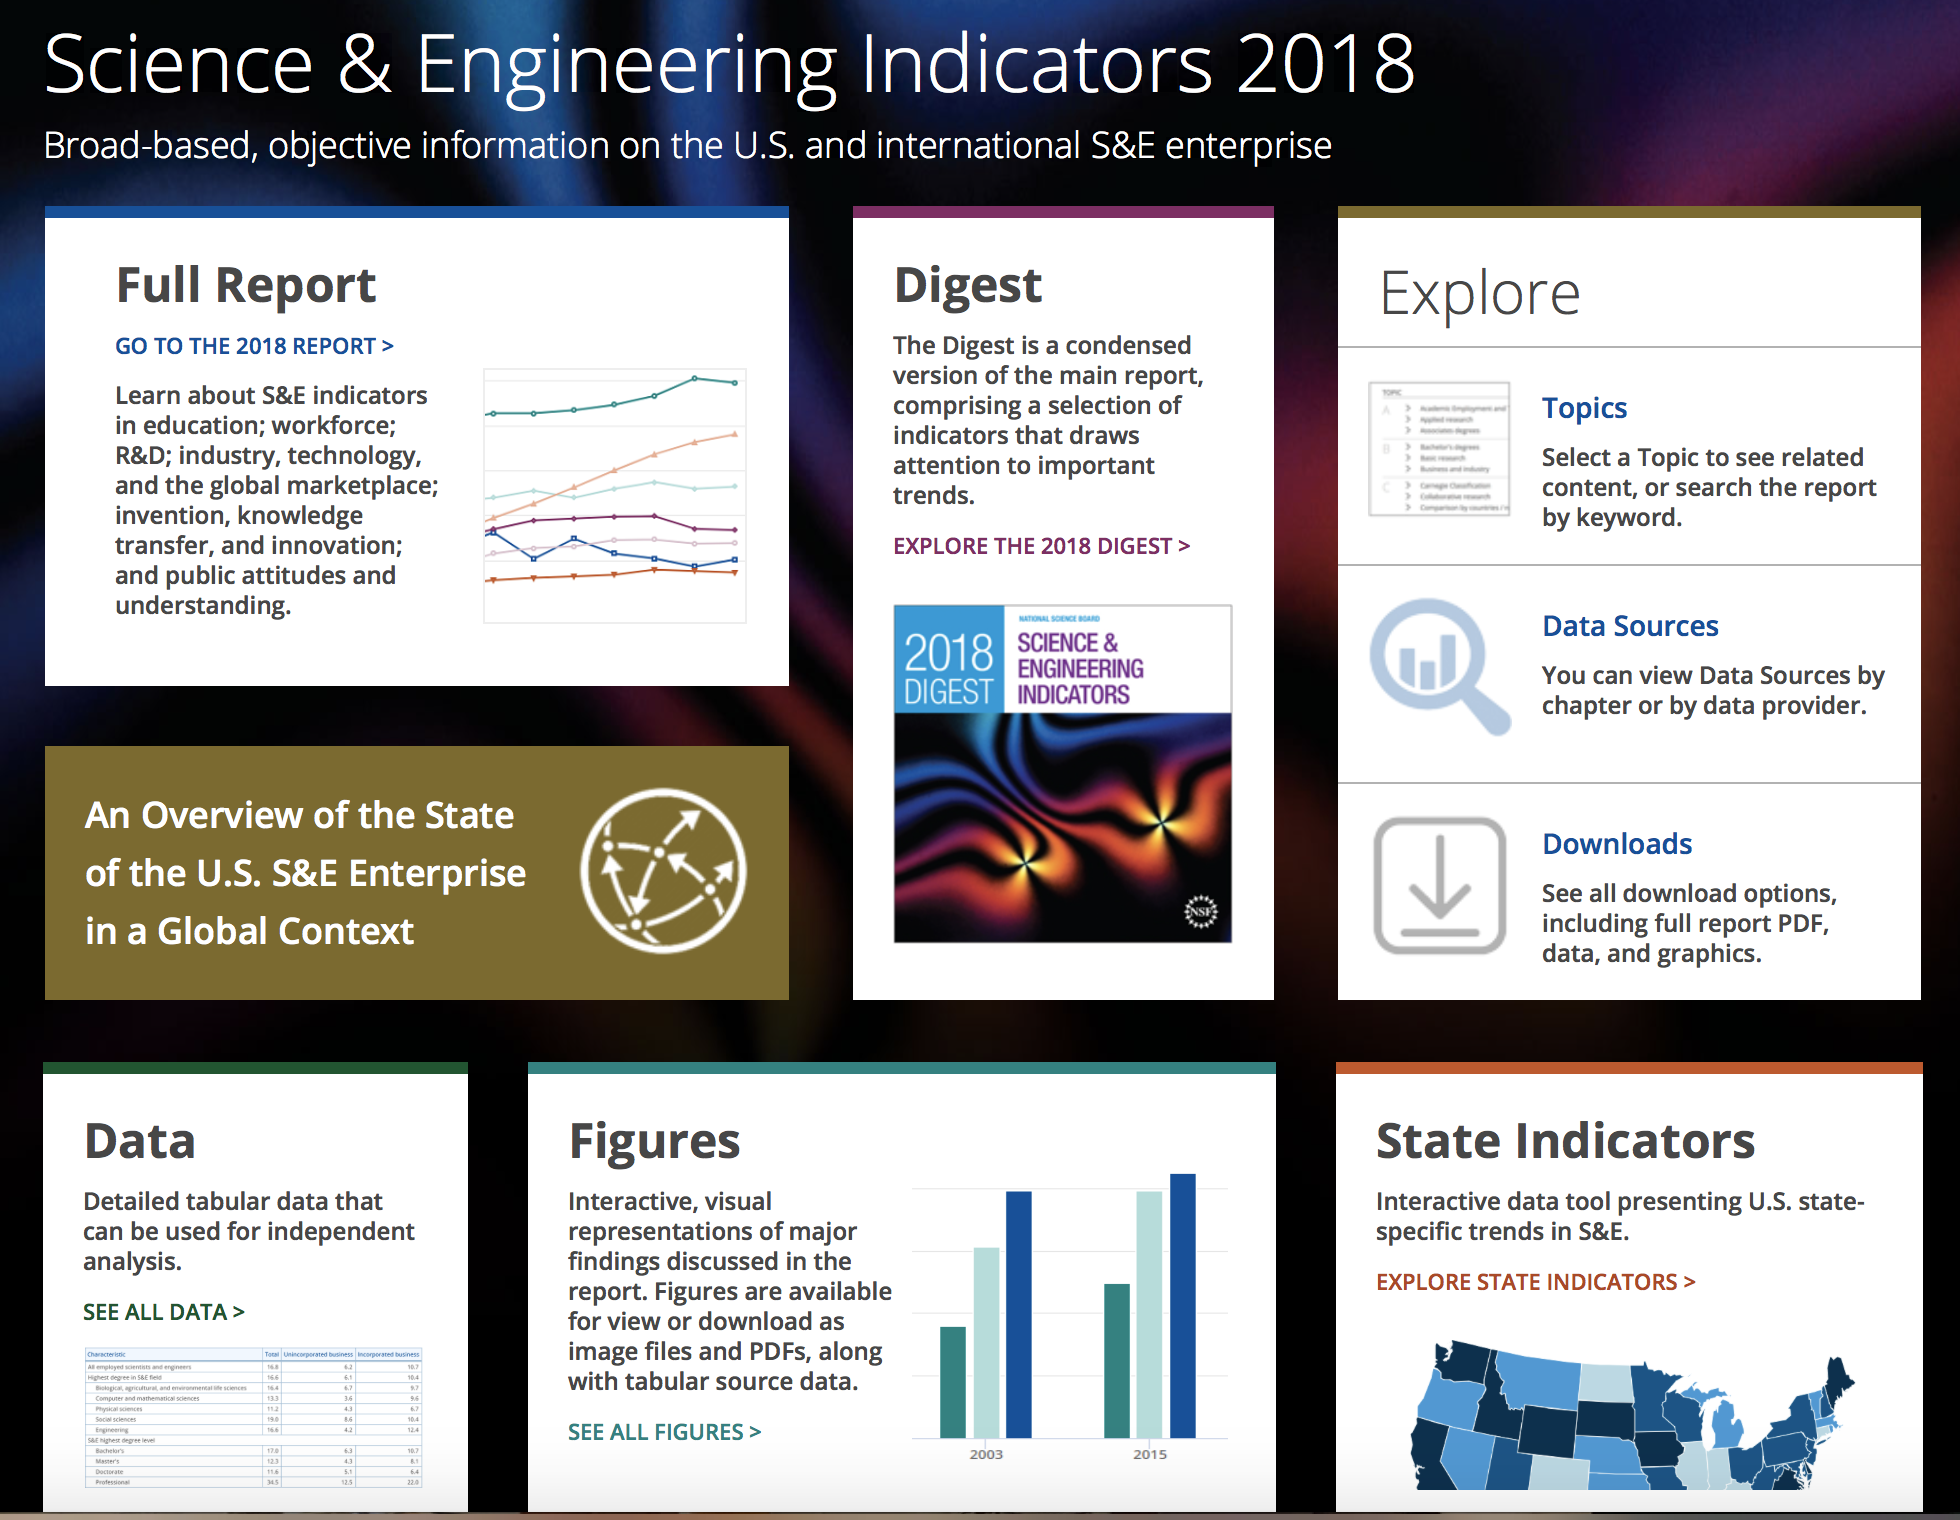 NSC has created a web presentation that makes it easy to roam through the report. NSB selected 42 S&E indicators and presented material in eight chapters covering education, workforce, R&D, public attitudes towards science, IP/Innovation, and industry. Data is drawn from many sources covering varying time periods. A fast way to zip through the material is to simply click on the figures section and march through them.
Here are a few noteworthy report bullets:
- Global R&D. The U.S. led the world in R&D expenditures at $496 billion (26 percent share of the global total), but China was a decisive second at 2 percent ($408 billion). China has grown R&D spending roughly 18 percent annually since 2000; its focus is primarily on development rather than basic or applied research. During the same time frame, U.S. R&D spending has grown by 4 percent.
- Venture Capital. China is no slouch here either; VC spending rose in China from approximately $3 billion in 2013 to $34 billion in 2016, climbing from 5 percent to 27 percent of the global share, the fastest increase of any economy. The U.S. attracted “nearly $70 billion,” slightly more than half of the $130 billion VCs invested globally in 2016.
- International Grad Students. The number of international students in the U.S. dropped between the fall of 2016 and the fall of 2017 with the largest declines in graduate level computer science (13 percent) and engineering (8 percent). That’s not surprising given the current political climate. “These students are a critical component of the U.S. workforce in these high demand fields,” according to the report.
- Regional S&E Specialization. Invention is a good example. “Of the three leaders in U.S. Patent and Trademark Office patents, U.S. and EU inventions are concentrated in chemistry and health, including pharmaceuticals and biotechnology. Japan’s patents are primarily in semiconductors, telecommunications, optics, and materials and metallurgy. Information and communication technologies—including digital communications, semiconductors, telecommunications, and optics—are mainstays of South Korea and China.”
Like past efforts, the 2018 Science and Engineering Indicators report is a massive effort.
“NSF’s Science and Engineering Indicators is the highest-quality and most comprehensive source of information on how the U.S. scientific and engineering enterprise is performing domestically and internationally,” said NSF Director France Córdova. “The 2018 report presents a wealth of easily accessible, vital data. It provides insights into how science and engineering research and development are tied to economic and workforce development, as well as STEM education, in the U.S. and abroad.”
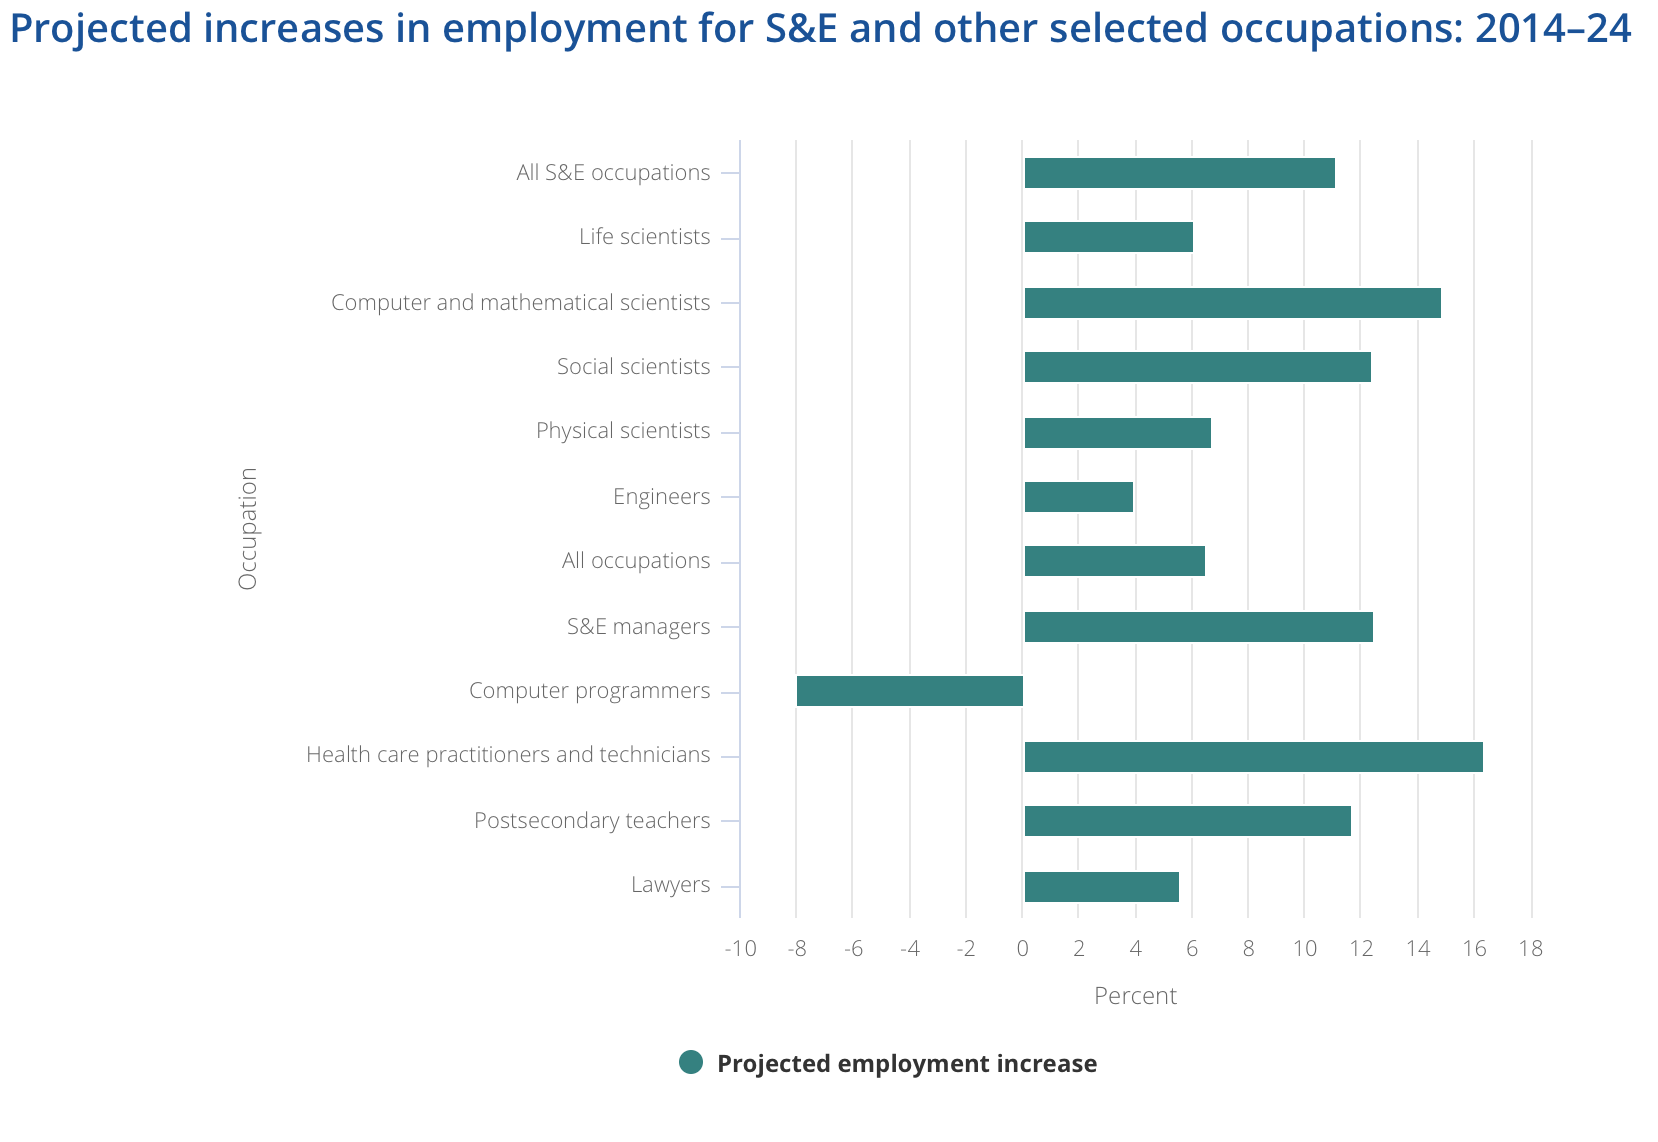
S&E workforce assessment is always an important part of the report and nowhere is the workforce challenge greater than in computer sciences. The Bureau of Labor Statistics has projected 23 percent growth from 2014 to 2024 in the computer systems design and related services industry – from 1,777,700 jobs in 2014 to 2,186,600 jobs in 2024.
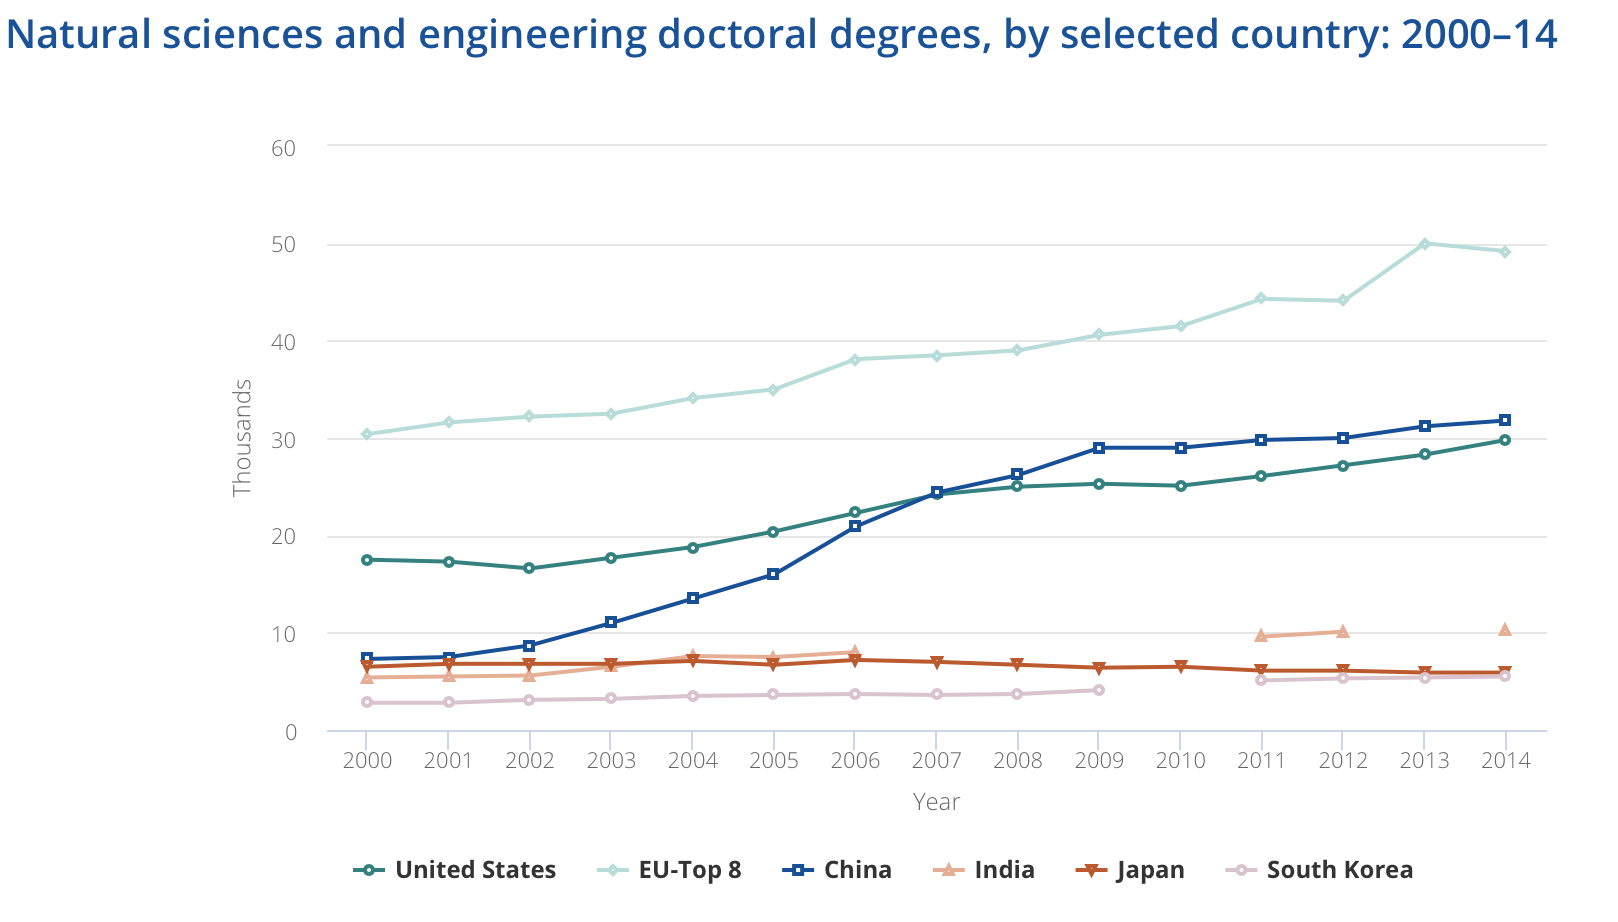
Commenting on this year’s results, Steve Conway, senior VP, Research, Hyperion Research, noted that China has moved far ahead in graduating bachelor degree level students. In 2015, the report’s most recent year, China graduated 1.6 million students, compared with 742,000 in the U.S. and 780,000 in Europe’s top eight countries combined. But that’s misleading, according to Conway.
“Things looks different at the Ph.D. level, where China had a modest lead over the U.S., 34,000 to 25,000, but Europe’s top eight countries together produced 58,000 doctoral graduates. This is further evidence that Europe is as strong a contender in the exascale race as the U.S. and China, adding to the EuroHPC initiative’s recently announced plan to spend another 1 billion euros on exascale development by 2020,” said Conway. (see chart below)
Interestingly, the number of computer programmer positions is forecast to shrink by 8 percent over the 2014-2024 timeframe while computer and mathematical scientists positions will grow 14.9 percent according to BLS. Again, the Indicators report is a broad measure. Within HPC the mix of skills sought changes over time. Expertise in parallel programming, for example, is at a premium currently and likely to remain so for some time.

This year the NSB slightly revised its definition of technology-rich industries. Here are the new ones:
Knowledge- and technology-intensive (KTI) industries: Those industries that have a particularly strong link to science and technology. These industries are five service industries—financial, business, communications, education, and health care; five high-technology manufacturing industries—aerospace; pharmaceuticals; computers and office machinery; semiconductors and communications equipment; and measuring, medical, navigation, optical, and testing instruments; and five medium-high-technology industries—motor vehicles and parts, chemicals excluding pharmaceuticals, electrical machinery and appliances, machinery and equipment, and railroad and other transportation equipment.
Knowledge-intensive services industries: Those industries that incorporate science, engineering, and technology into their services or the delivery of their services, consisting of business, information, education, financial, and health care.
According to the report KTI industries produce roughly one-third of the world GDP. “America” leads in providing business, financial, and information services, accounting for 31percent of the global share, followed by the European Union (EU) at 21 percent. China is the third largest producer of these services at 17 percent and continues to grow at a far faster rate (19 percent annually) than the U.S. and other developed countries. The U.S. is the largest producer of high technology manufacturing (31 percent global share). This includes production of air and spacecraft, semiconductors, computers, pharmaceuticals, and measuring and control instruments. China is second at 24 percent, more than doubling its share over the last decade.

Amid all of the gut-wrenching of the international S&E scorekeeping it’s worth remembering that modern science is intensely collaborative and cuts across national borders. This is evident in scientific publishing. Among the major producers of S&E publications, the United Kingdom had the highest international collaboration rate (57 percent) in 2016, followed by France (55 percent), and Germany (51 percent). The U.S. followed with a 37 percent international collaboration rate, up 12 percent from 2006.
Overall, there are few dramatic changes noted but some accelerated trends in the 2018 S&E Indicators report. Fortunately NSB has made the report easy to peruse.
Link to report: https://www.nsf.gov/statistics/2018/nsb20181/