BigDATAwire
 AIwire
 HPCwire Japan
 QCwire
 HPC & AI Wall Street
ISC High Performance 2021 kicked off yesterday with a keynote from Dr. Xiaoxiang Zhu, a professor of data science and Earth observation at the Technical University of Munich. The conference, held virtually for the second time due to the ongoing coronavirus pandemic, featured a surprisingly COVID-light agenda, seeming to focus instead on building a better new normal than the status quo that the world left behind in 2020. To that end, Zhu’s keynote spotlighted how HPC-powered Earth observation data processing, carefully applied, has an incredible amount of transformative power.

Zhu’s presentation kicked off with a graphic of a slowly spinning Earth with a lone satellite in polar orbit around it. As the Earth rotated, that polar orbit slowly gave the satellite coverage over the planet.
“We are living in a golden age of Earth observation,” Zhu said. The game-changer, she explained, was the European Space Agency’s Copernicus program and its Sentinel satellite fleet – an “evolutionary change” in Earth observation that occurred around 2014 to 2015, resulting in an explosion in satellite data. “The data we have so far [is] around 40 petabytes, and in 2030, it will become 140 petabytes,” Zhu said. “And what is more important is that most of the data is provided by the Sentinel satellite fleet, [which is] following the so-called ‘free and open policy.’ This means these petabytes of data are accessible to everybody – and also, you, who are in the audience.”
“Without any doubt,” she stated, “Earth observation is now a big data problem.”
“Without any doubt, Earth observation is now a big data problem.”
This big data problem has big implications for a wide range of fields, from meteorology (“the classic field where we are providing information”) to “very practical things related to safety, security, mobility, resource management and … city planning.”
“In my lab,” Zhu continued, “our vision is that we want to develop innovative AI and data science solutions in Earth observation for tackling societal grand challenges – for example, urbanization, climate change, or the UN’s SDGs [Sustainable Development Goals].”
Leveraging the petabytes of Earth observation data in service of these goals means enlisting “a wide range of expertise”: exploratory signal processing techniques, data fusion strategies and much more. And, of course: “If we talk about global applications then very easily we’re ending up with petabytes of geodata, satellite, social media data. Therefore, big data analytics and high-performance computing are very crucial components for the whole harvesting process.”
One of the most impressive efforts at Zhu’s lab is a deceptively simple pitch: global urban mapping.
A disparity in geoinformation
“We are now living on an urban planet,” Zhu said. “If you look at the urban population and the rural population – the evolution over time – you will figure out in 2008, there is a secret change [in] history: there are more people living in urban areas than rural areas. And this trend is going to increase in the future.”
As an isolated datapoint, this might not seem troubling. But the geospatial distribution of that accelerating urbanization, Zhu explained, was unequal: it was mostly occurring in developing areas that lacked sufficient urban planning to ensure that the urbanized areas were also safely habitable. By way of example: “In the last decade, nearly 50,000 fires happened in Mumbai,” Zhu said. “What was really shocking is [that] nearly 70 percent were simply caused by faulty wiring.”
“We are now living on an urban planet.”
In order to address those kinds of problems through improved urban planning, though, you need to know some basic geoinformation about the region. Where are the slums? Where are people living? How tall are the buildings? What functions do the buildings serve?
“We don’t have global information in fine detail available,” Zhu said. She pointed to OpenStreetMap, which she said many Europeans might view as a substantial source of such information. But while that might work for much of Europe, Zhu explained how small OpenStreetMap’s scope was in the scheme of the world. There are roughly three billion buildings in the world. 457 million of them – just 16 percent – are in OpenStreetMap. Of those, only three percent have height information – just half of one percent of the world’s buildings overall.
“And we,” Zhu said, “are using AI and data science to close this gap.”
Closing the building footprint gap
First, the team set out to collect building footprints. They used satellite data from Planet, a new aerospace company that provided data from around 140 very small satellites that Zhu said were able to provide data with an accuracy of four to five meters on a daily basis. Using training data from 74 cities, the team taught a graph convolutional neural network to understand the relationship between the satellite data and GIS-derived building footprints.
“All together, we processed more than 200,000 planet satellite images,” Zhu said. They were able to derive global building footprints from their model, allowing them to close the 84 percent gap of buildings that did not have footprints in OpenStreetMap.

Then came the hard part: transforming 2D satellite data into 3D data that could be used to derive building heights, as well.
Radar tomography
For that, Zhu and her team turned to data from TerraSAR-X, a German radar satellite. Here, they used a technique called “radar tomography,” which is akin to the computed tomography (CT) scans that use rotating blasts of x-rays to generate 3D images out of a stack of 2D images taken from different angles.
“Similar to CT, you are doing a scan of the patient, and each of these satellite images could be considered a tomographic slide,” Zhu said. “And every 11 days the satellite will fly over the same area, taking the image from slightly different positions. After we build up enough … images, we’re able to basically do the reconstruction with tomographic methods.”

“Similar to CT, you are doing a scan of the patient[.]”
This radar tomography work is extraordinarily compute-intensive, and it is, accordingly, powered by the HPC resources from the Leibniz Supercomputing Centre (LRZ). Zhu is a self-described “power user of SuperMUC[-NG],” the center’s largest supercomputer. SuperMUC-NG, which launched in 2018, consists of 6,336 Intel Xeon Skylake-powered “thin” compute nodes (each with 96 GB of memory) and 144 Skylake-powered “fat” compute nodes (each with 768 GB of memory). All told, SuperMUC-NG delivers 19.5 Linpack petaflops, placing it 17th on the most recent Top500 list (which launched the same day as the keynote).
“We are … using a lot of computing resources from the Leibniz Supercomputing Center, because eventually if we boil everything down to formulas we are solving for each of … approximately ten thousand times five thousand pixels,” Zhu said. “For each of those pixels, we are solving a long convex optimization problem with a matrix dimension of 100 times one million, and here we get a lot of support from Leibniz Supercomputing Center and have been granted … 46 million CPU hours for our social good project.”
And now, Zhu said, “I’m happy to show you around Berlin!”
A pointillist metropolis — and eventually, a world
The detail on display is undeniably extraordinary: from the satellite data alone, radar points highlight individual statues and lampposts. The researchers could even see how buildings expanded and contracted in response to seasonal weather changes. “We are getting, in the end, a point cloud with a density of one million points per square kilometer,” Zhu said.
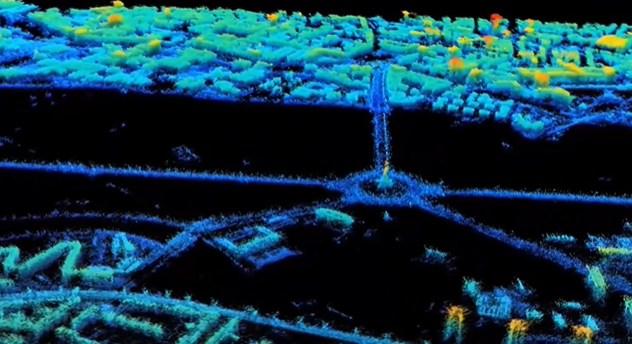
Combining this point cloud with the building footprints, they got building maps, complete with elevation by building. To start, the researchers worked with major cities, which offered points of comparison for validating their work. After comparing their results for 30,000 buildings with precise lidar data for the same buildings, the researchers found the height estimation to be “better than two meters.”
“For Europe, this is probably nothing really breathtaking,” Zhu said – but for areas without even building footprints available, it was something else entirely.
As of the keynote, Zhu said that the researchers had already processed more than 1,700 cities, including all cities with populations over 300,000. To complete the radar tomography globally, she said, “we can use the same technique, but we need ten times the data.”
Throughout the talk, Zhu referred back to the UN’s Sustainable Development Goals, a set of 17 objectives set forth in 2015 that range from ending hunger to ensuring affordable and clean energy. This work, for Zhu, falls under the first goal (“no poverty”) and the eleventh (“sustainable cities and communities”).
“We are making this data open and free,” she said. “And we are hoping, by providing this information, we could contribute[.]”